


The Next 5 Years in Bitcoin: Part 1 - Halvings
Pre-amble:
This article is Part 1 of an extended series and larger report on ‘The Next 5 Years in Bitcoin’. While pundits love to throw around price targets, we like taking a quantitative approach using a variety of methods. Each part is in part both a commentary on price but also commentary on the bitcoin economy as a whole. What do Halvings, miner capitulations, and on-chain transaction trends tell us about bitcoins price from a purely quantitative perspective, and what narrative do they tell us from a fundamental perspective. While we dive into the nuts and bolts of the bitcoin economic machine on a daily basis, we like to take this series as an opportunity to shine some light on a number of these subjects and add a quantitatively neutral flavor to the predominantly perma-bull or perma-bear opinion pieces that flood the internet. All insights should be approached with mathematical and economic curiosity, yet not be construed as investment advice. While the data can be publicly verified, we neither agree nor disagree with the extrapolations of that data. This in large will be a guided exploration, and our internal opinions and projections will ultimately remain proprietary to Hartmann Capital.
Abstract:
Halvings are likely the most anticipated events in bitcoin, next to hard-forks. It has become a common assumption that a Halving equals the beginning of a new bull run and significant price appreciation in the short run. In this paper we aim to dive into the price action data behind Halvings, and establish patterns and trends that prove to be consistent and repeatable. While the data allows us to extrapolate a market top around $200,000 in Q4 2021, we maintain a healthy skepticism around the limited historical data-set bitcoin offers, having only experienced 2 Halvings to date.
However this limited data set gains in significance due to:
1. It’s high correlations
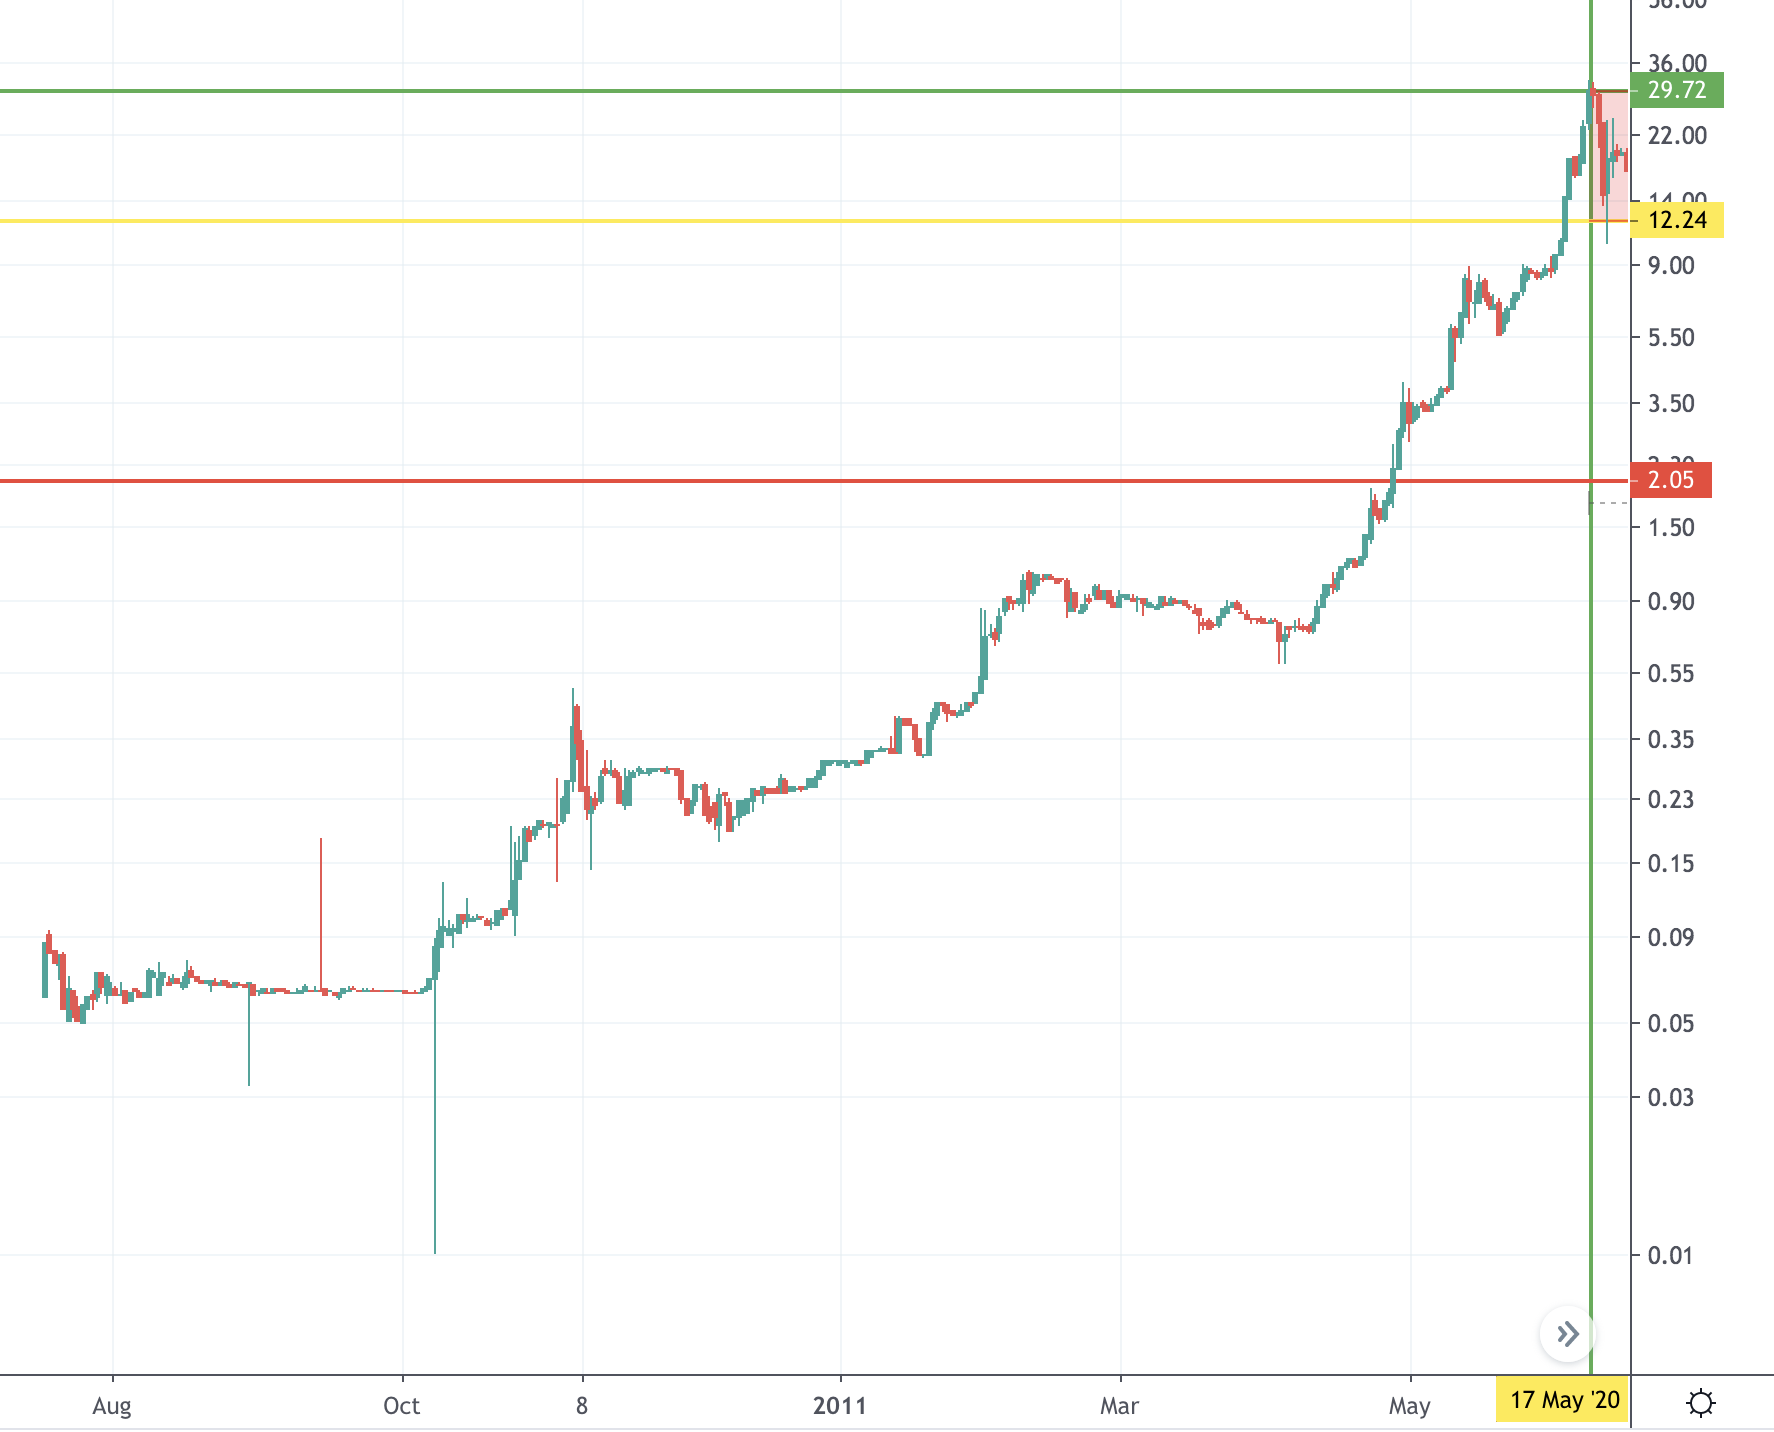
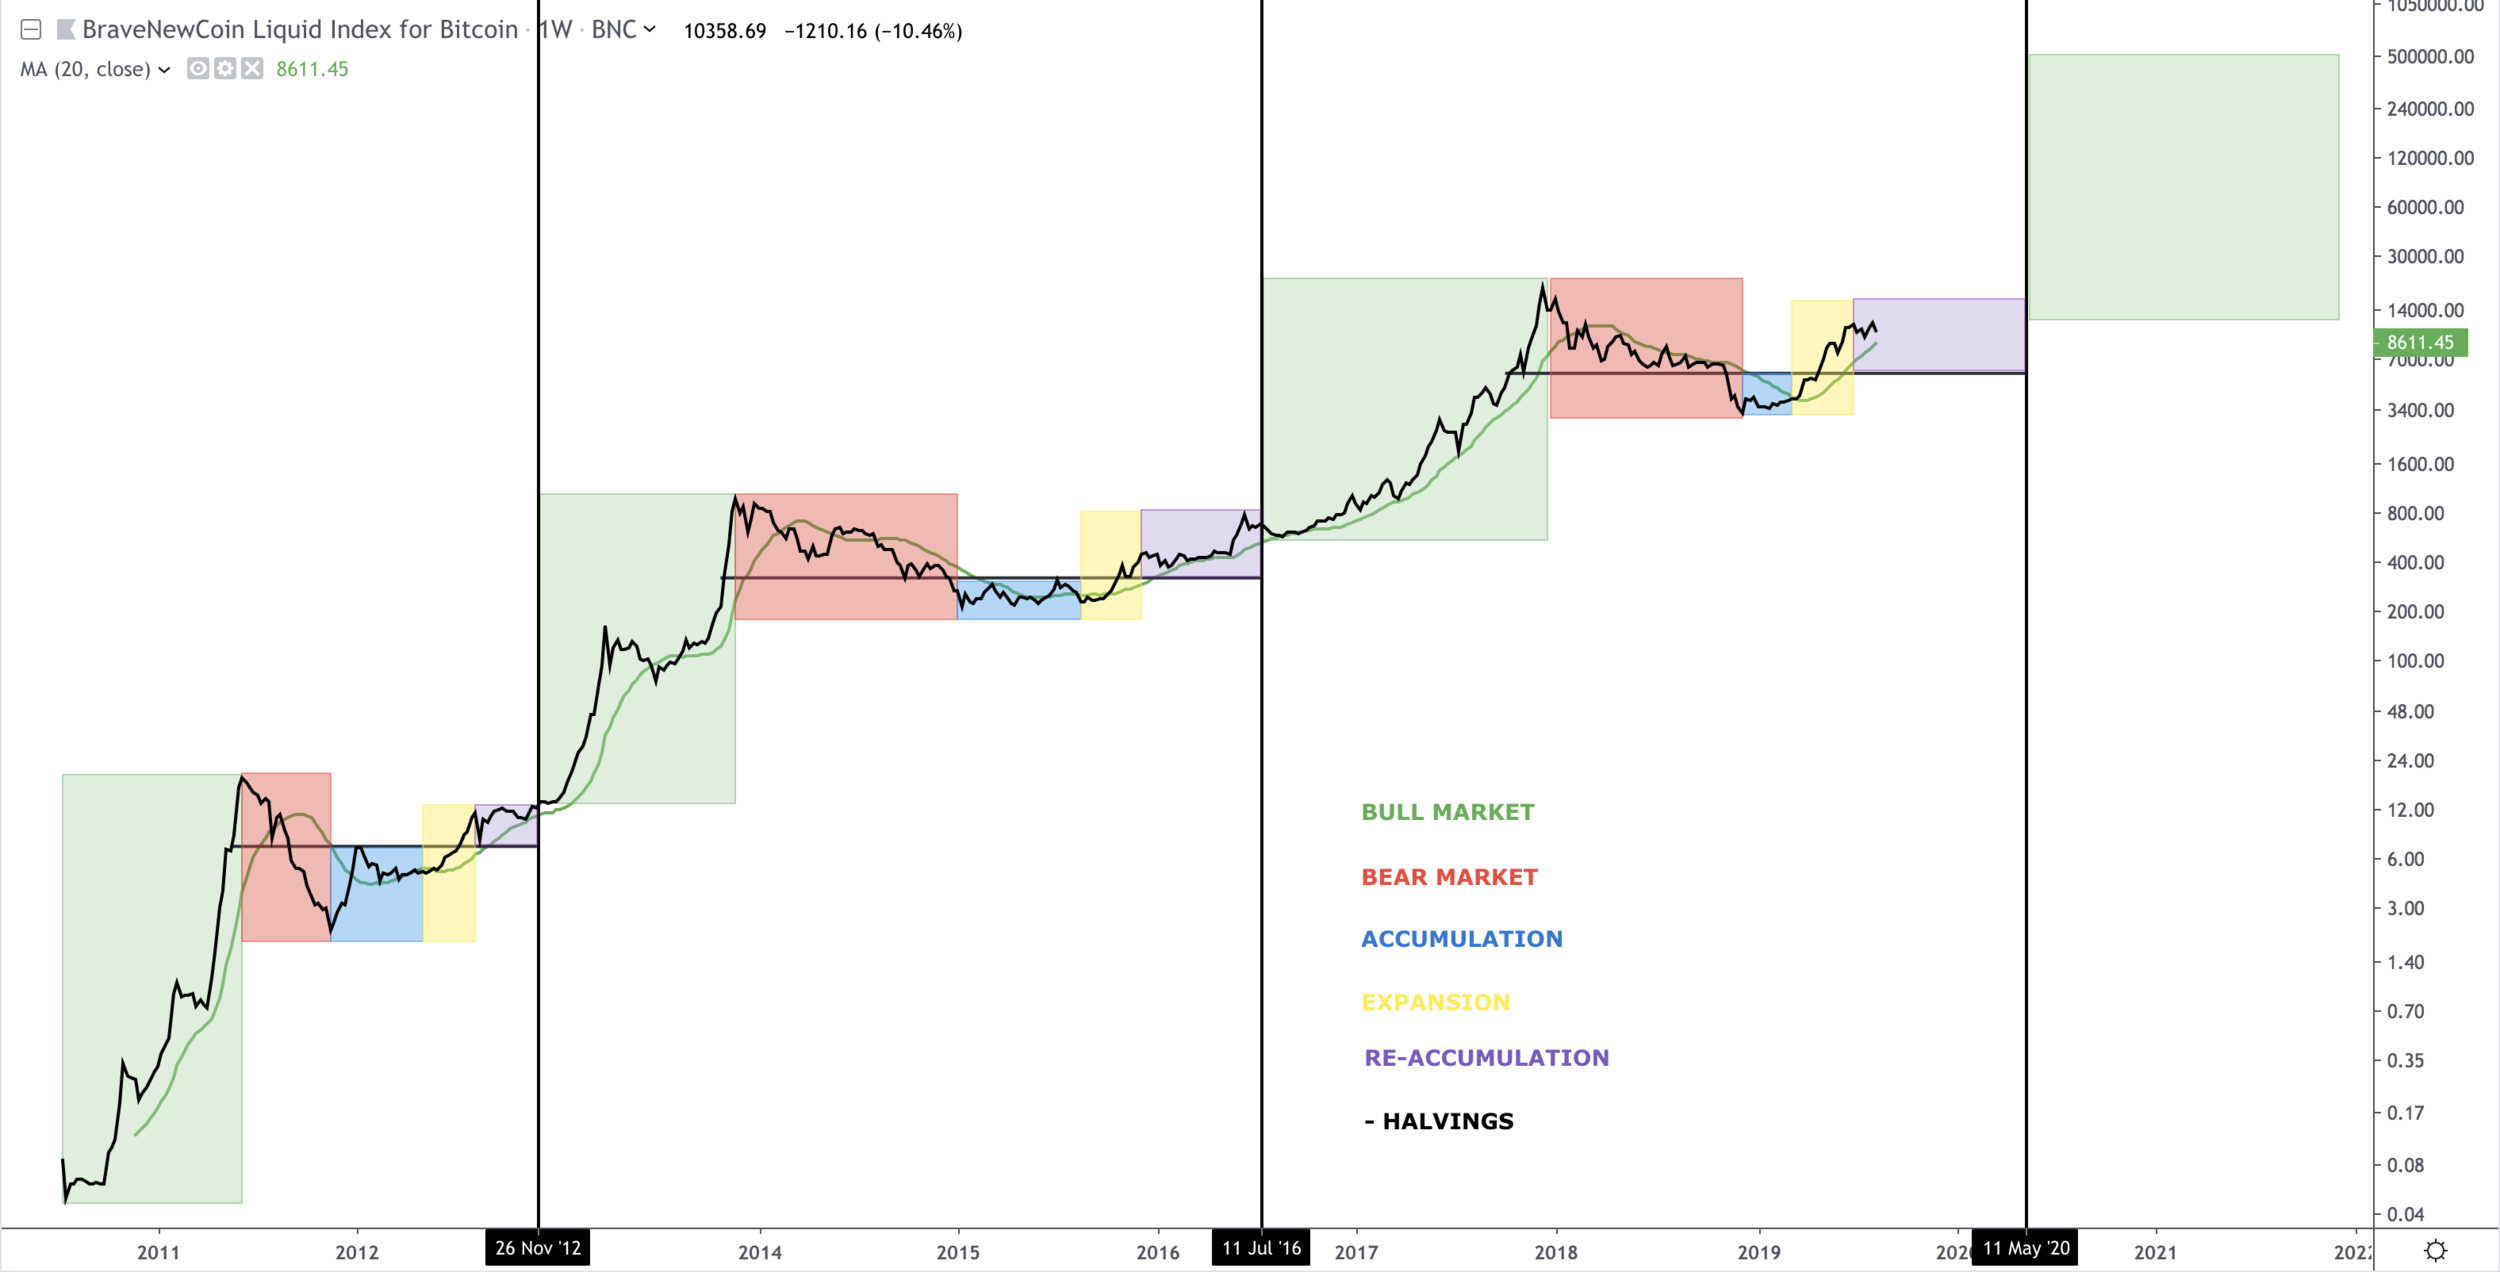
All three bear markets experienced a decline around 85%
Both Halving prices were roughly 50% down from ATH
Halvings occured roughly 500 days from market bottom
etc.
2. It’s economic impact
Halvings have a direct impact on the supply-side economics of bitcoin. With each Halving, the daily selling pressure by miners is reduced. While this is an extremely bullish indicator from 2009 to 2024, we do see its impact tapering off in the coming 5 years, due to supply-side flow reductions becoming negligible.
I. Data:

Source: BitcoinTalk.org

Note that much of the existing Data is highly limited. It’s important to highlight that any of the following extrapolations are no more than hypotheses. The value in these is less so in providing a definite price target, but rather in seeing whether different modes of analysis achieve similar results. If so, we can carefully take our hypothesis more seriously and let time put it to the test.
II. Data Patterns and Extrapolations:
% Growth from Bottom
Two extrapolations can be deducted
Growth as an Average:
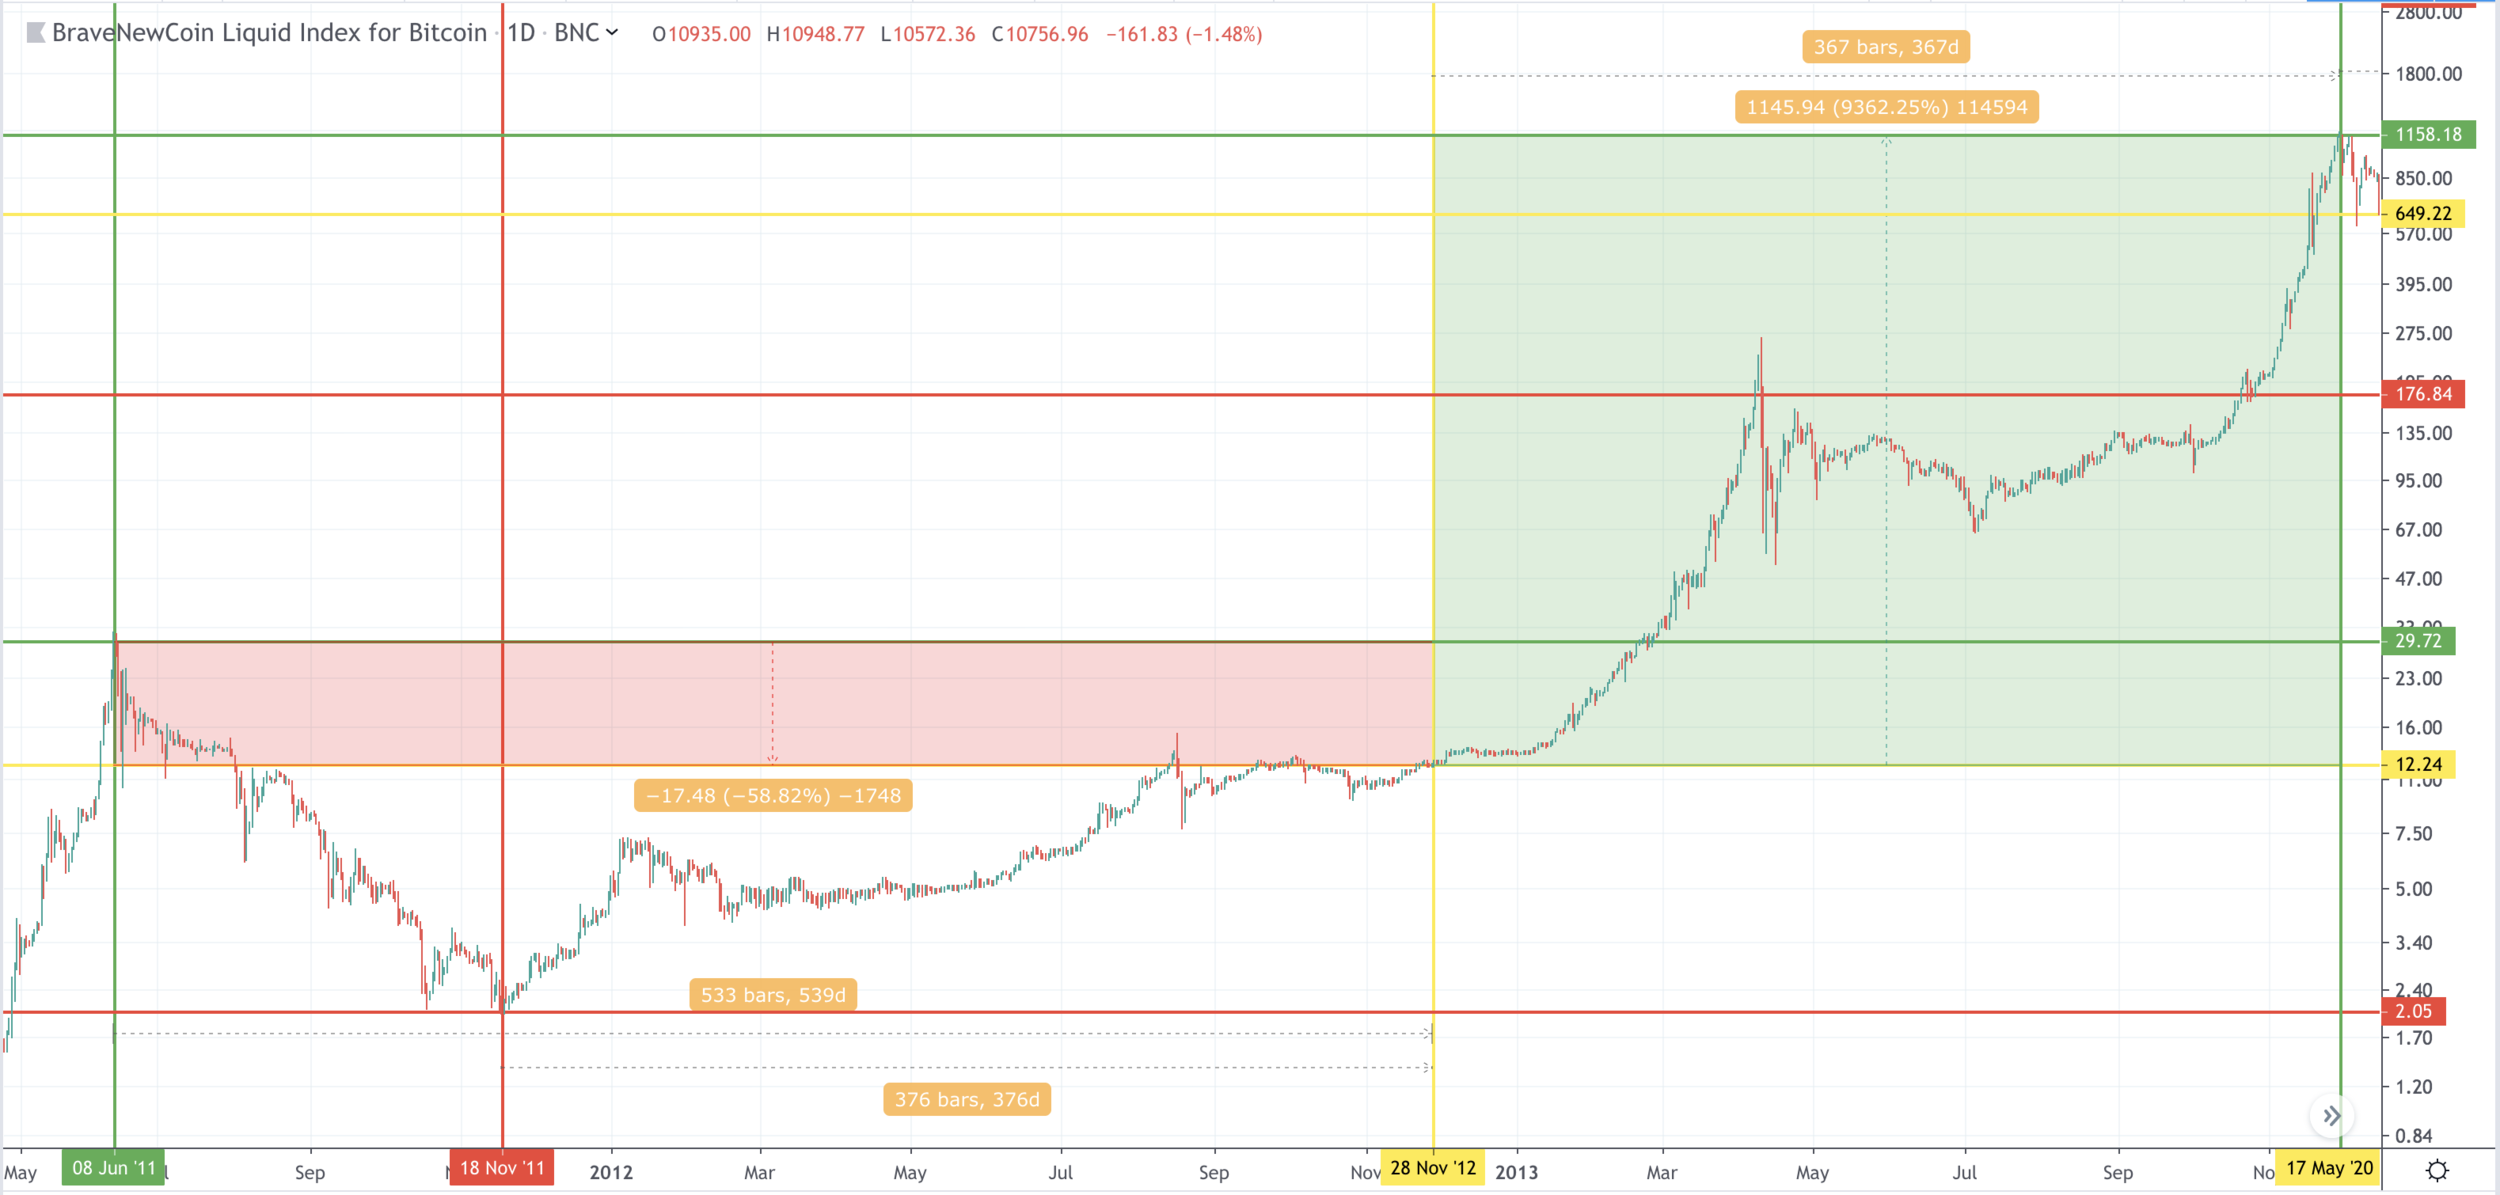
As the name suggests we combine the two definite data points we have and take an average. This leads us to an average Growth of 382% from cycle bottom to Halving. For 2020 this would put price at $15,460.29
Growth as a Trend:
Since it is possible that growth slows with each cycle, we seek the factor between the growth rates, which is .5372.
Applied to the last cycle’s rate, we can deduct a Trend-Based Growth Rate of 143.43% from cycle bottom to Halving. For 2020 this would put price at $7,808
% Down from last Peak
Two extrapolations can be deducted
Decline as an Average:
We combine the two definite data points we have and take an average. This leads us to an average Decline of 51.38% from cycle top to Halving. For 2020 this would put price at $9,395.
Decline as a Trend:
Since it is possible that decline slows with each cycle, we seek the factor between the growth rates, which is .747.
Applied to the last cycle’s rate, we can deduct a trend-based decline rate of 32.82% from cycle bottom to Halving. For 2020 this would put price at $12,982.02
Price at Following Cycle Peak
Here we have 3 pieces of data, which can provide us with 2 further data points in % change, and a further data point in the rate of change of % change.
From Peak to Peak 2011-13 we saw a growth of 3796.97%
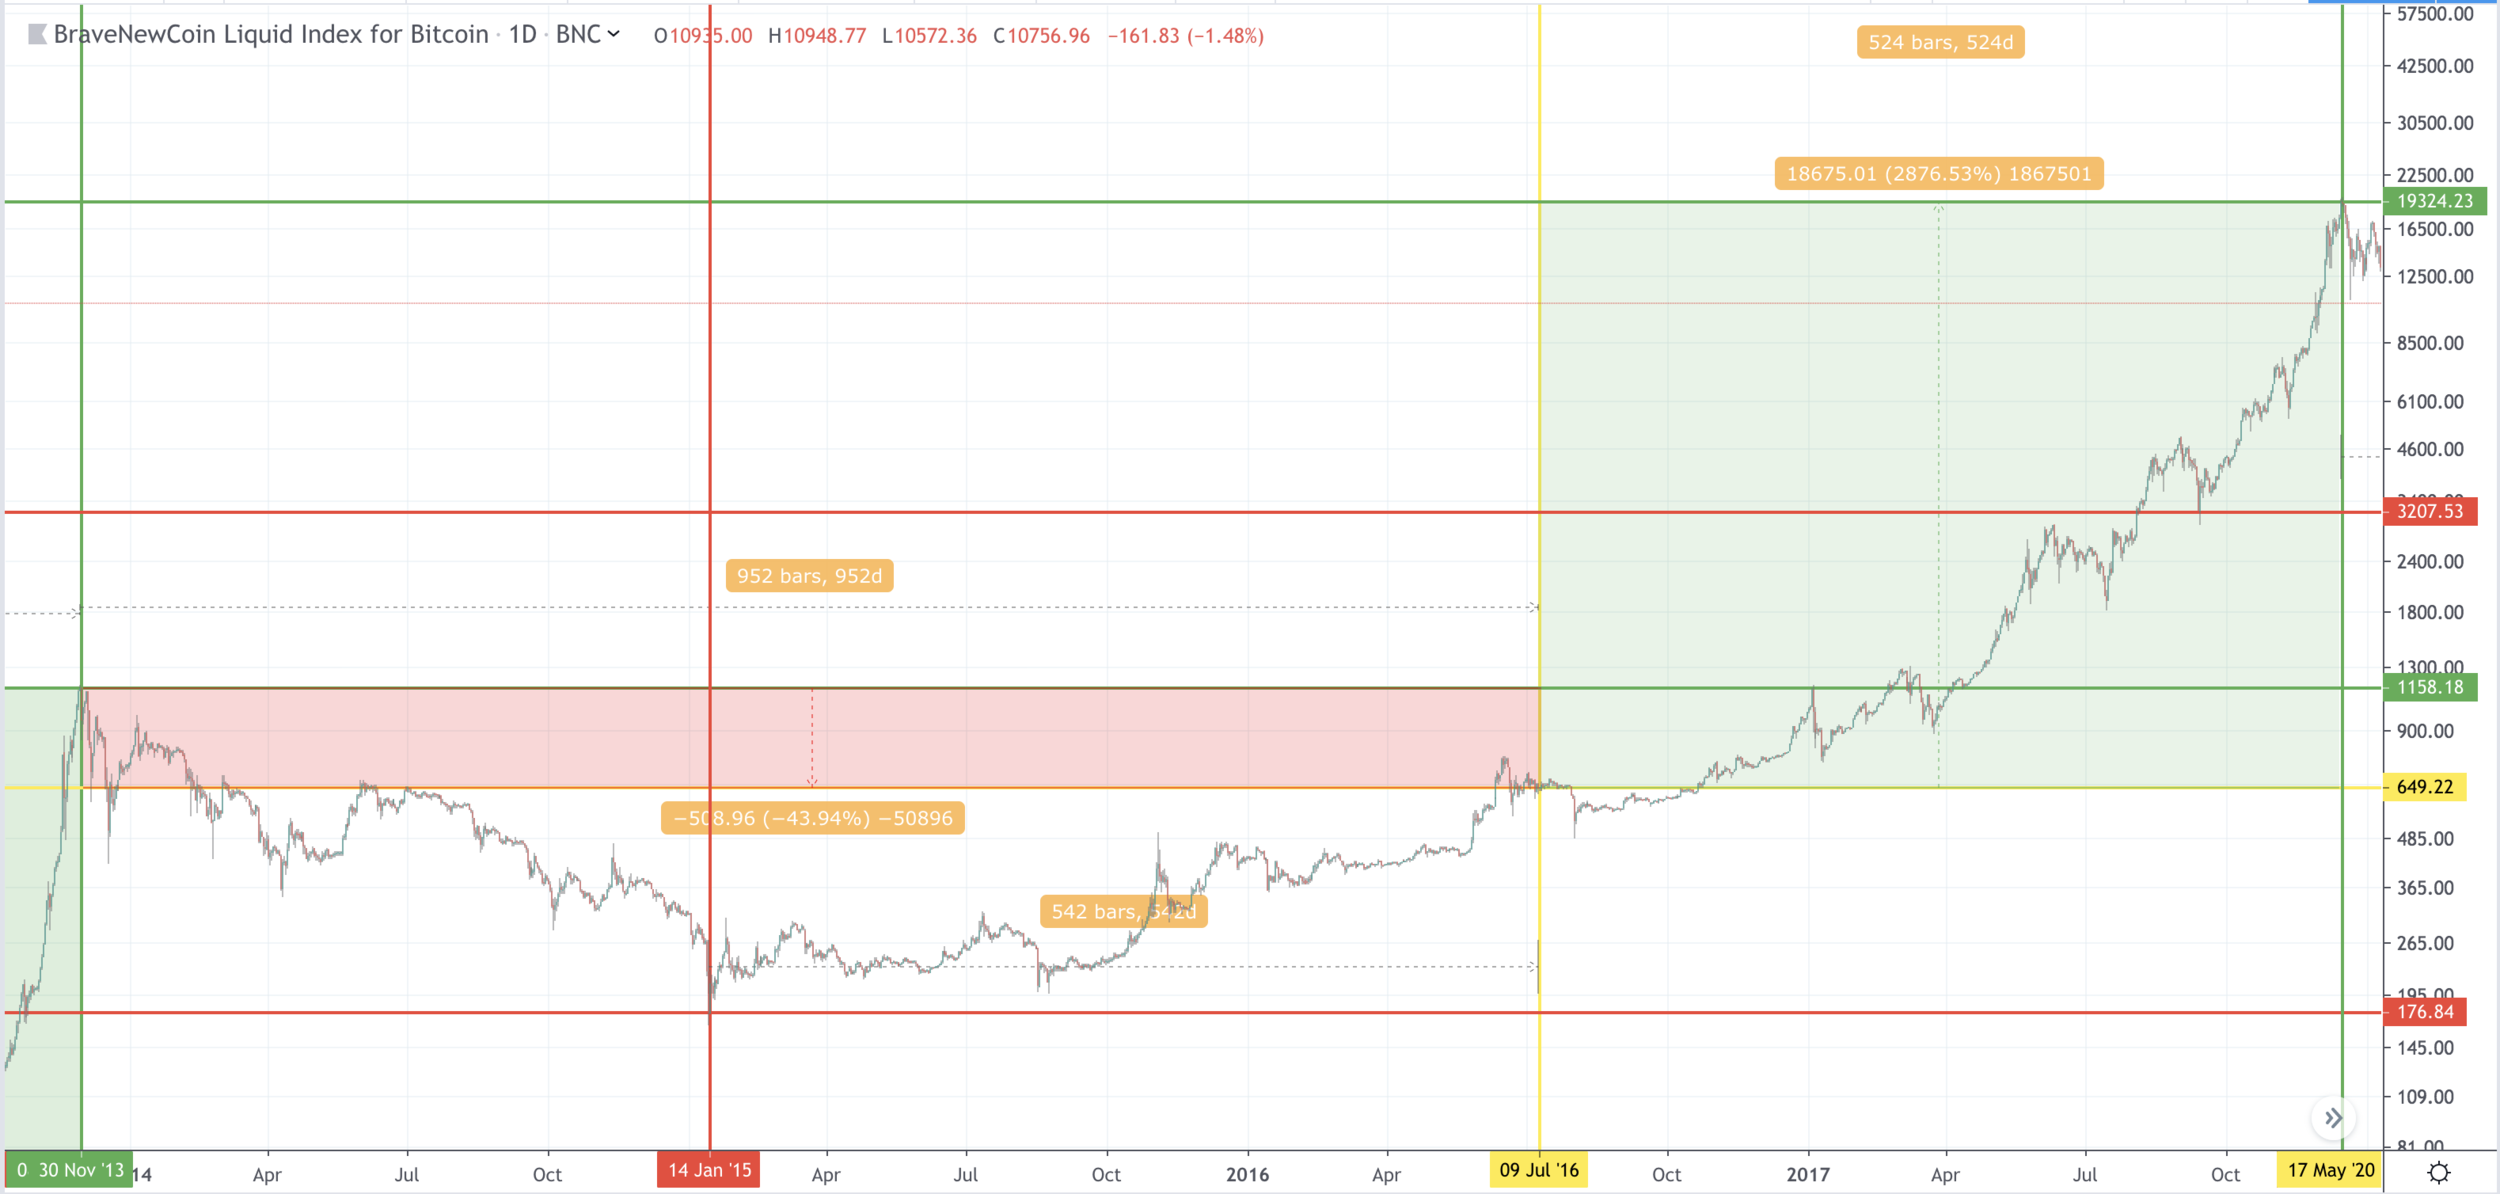
From peak to peak 2013-2017 we saw a growth of 1568.50%
Growth as an Average:
We combine the two definite data points we have and take an average. This leads us to an average growth of 2,682.735% from cycle top to cycle top. For the 2020-2024 cycle this would put price at $537,742.
Growth as a Trend:
Since it is possible that growth slows with each cycle, we seek the factor between the growth rates, which is .413.
Applied to the last cycle’s rate, we can deduct a trend-based growth rate of 647.935% from cycle bottom to Halving. For the 2020-2024 cycle this would put price at $144,532.8
Days to Following Cycle Peak
Time as an Average:
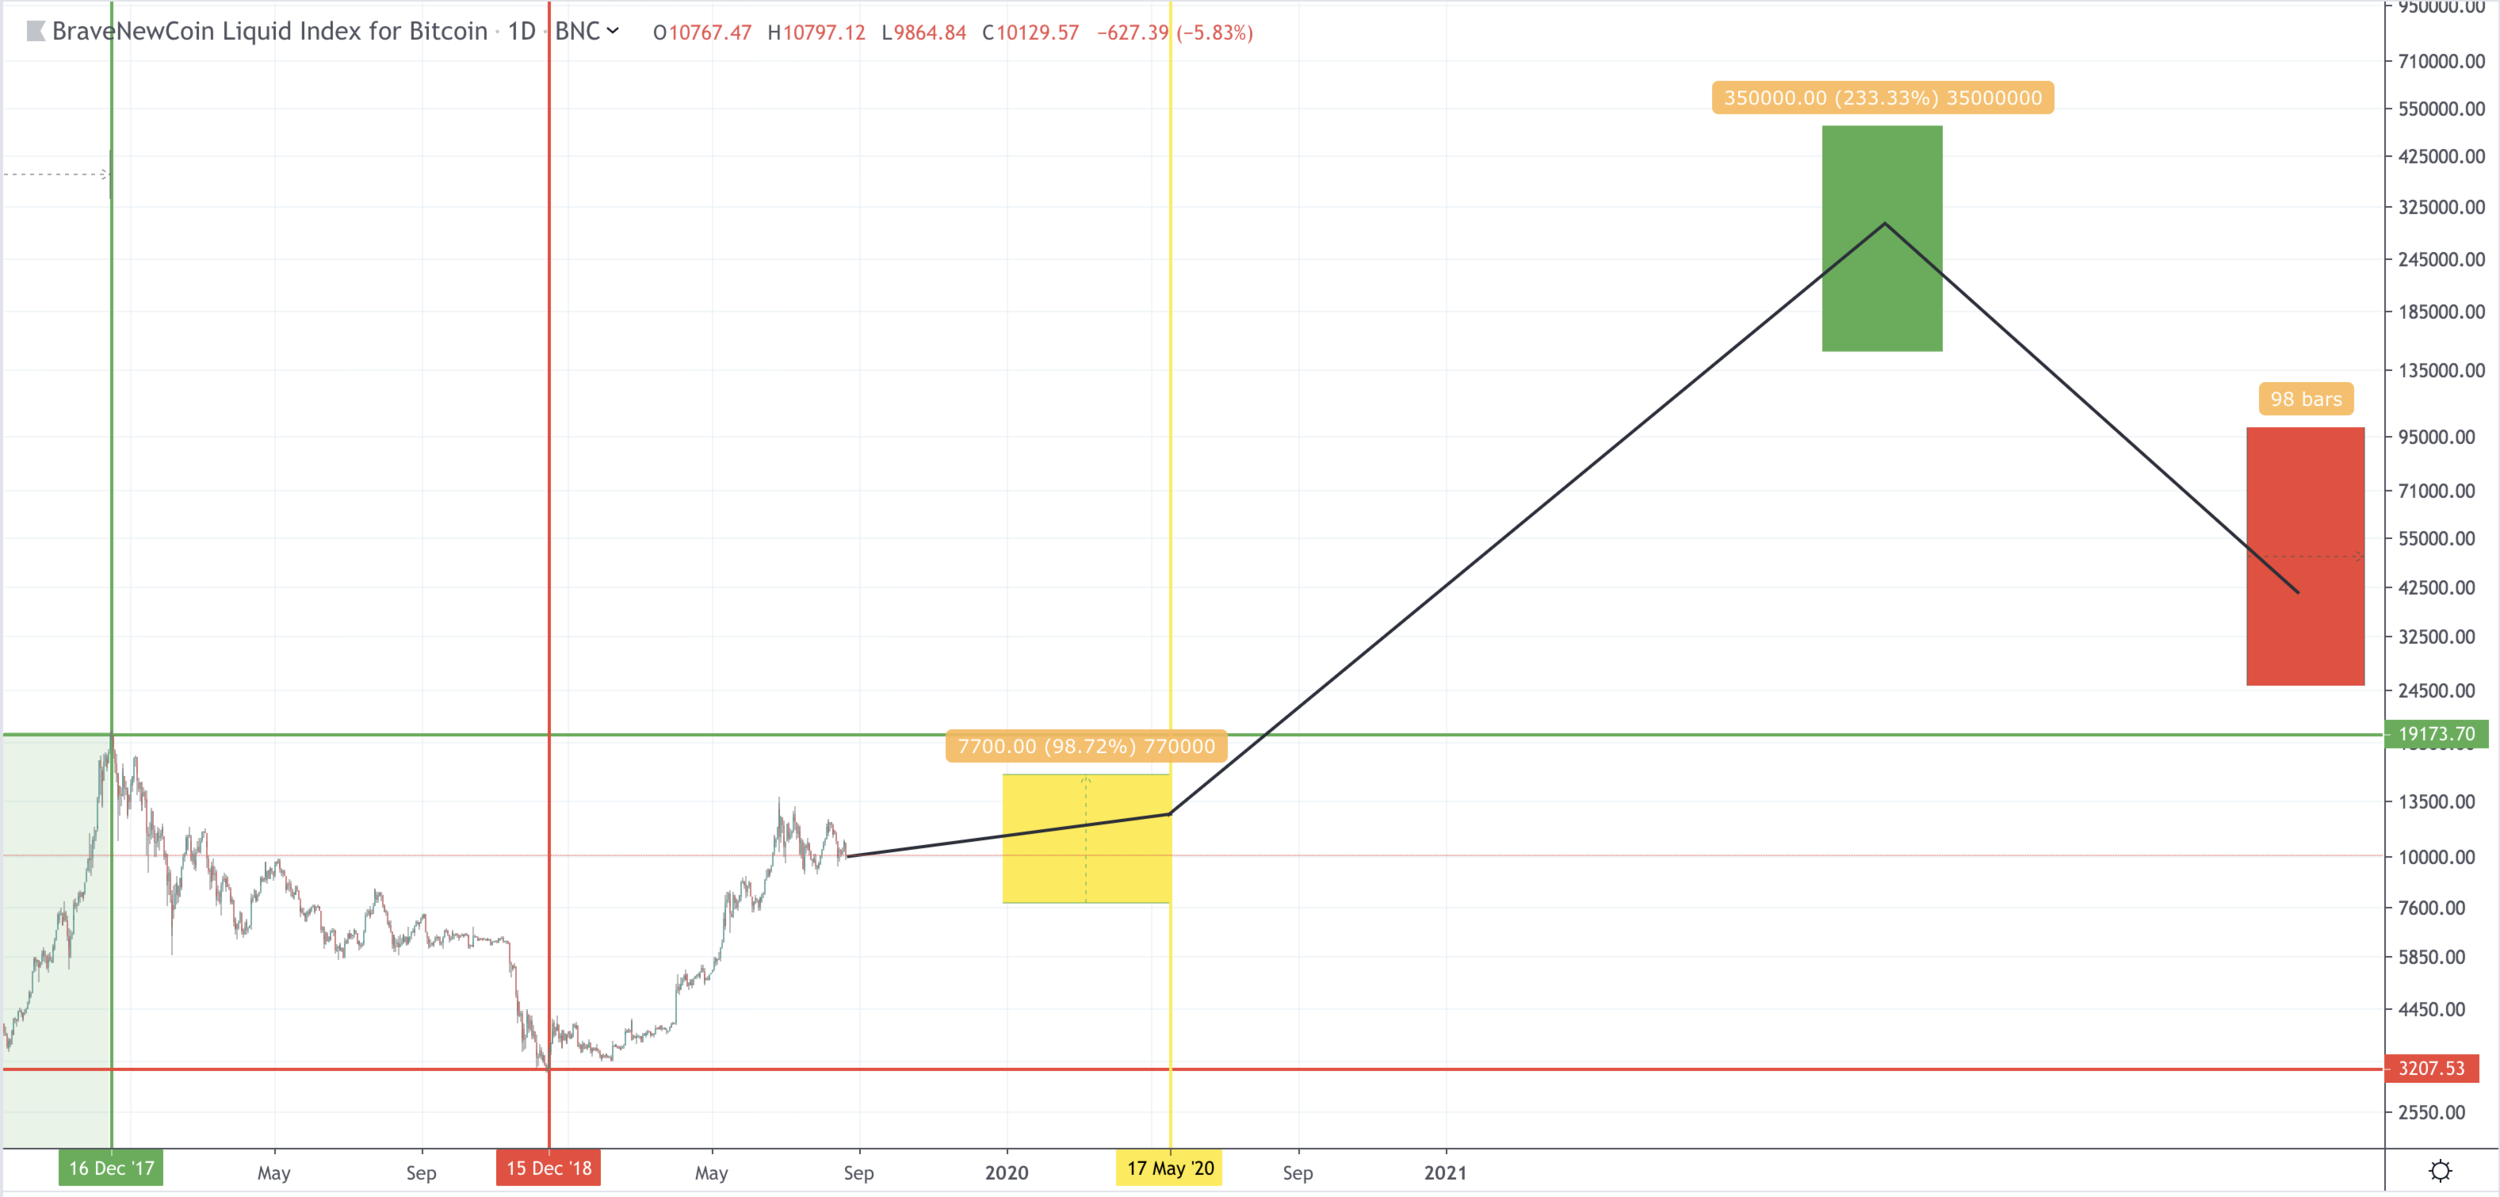
We combine the three definite data points we have and take an average. This leads us to an average time of 592 days from Halving to cycle top. For the 2020-2024 cycle this would put the price peak around December 30th, 2021.
% Growth from Halving to Peak
Two extrapolations can be deducted
Growth as an Average:
We combine the two definite data points we have and take an average. This leads us to an average growth of 6119.39% from Halving to cycle top. For the 2020-2024 cycle this would put the price peak between $485,579 - $961,475 based on our identified range in ‘Data Patterns and Extrapolations’ 1. and 2.
Growth as a Trend:
Since it is possible that growth slows with each cycle, we seek the factor between the growth rates, which is .3072.
Applied to the last cycle’s rate, we can deduct a trend-based growth rate of 883.8% from Halving to cycle top. For the 2020-2024 cycle this would put the price peak between $76,752 - $152,098 based on our identified range in ‘Data Patterns and Extrapolations’ 1. and 2.
Days from Bottom
Time as an Average:
We combine the three definite data points we have and take an average. This leads us to an average time of 497 days from market bottom to Halving. For the 2020-2024 cycle this would put the price bottom around December 2022.
Price at Bottom
Here we have 3 pieces of data, which can provide us with 2 further data points in % change, and a further data point in the rate of change of % change.
From bottom to bottom 2011-2015 we saw a growth of 8,526.26%
From bottom to bottom 2015-2018 we saw a growth of 1,713.8%
Growth as an Average:We combine the two definite data points we have and take an average. This leads us to an average growth of 5120.03% from cycle bottom to cycle bottom. For the 2020-2024 cycle this would put price at $167,434.
Growth as a Trend:
Since it is possible that growth slows with each cycle, we seek the factor between the growth rates, which is .2.
Applied to the last cycle’s rate, we can deduct a trend-based growth rate of 344.47% from cycle bottom to cycle bottom. For the 2020-2024 cycle this would put price at $14,256.
These findings are not in line with the pattern of establishing bottoms above the peak from two cycles ago.
To further provide a bottom framework we compare bottom to peak relation.
Based on this data we can get the following estimations:
On average the market sustains an 87% drop from its peak. When the top is in, it makes sense projecting a bottom using this metric, however till then, we are not fans of estimating using estimates.
Using the rate of change between bitcoin’s growth from bottom above prior cycle’s peak, we can also estimate a bottom around $26,234, which structurally appears to be most in line. At an 87% decline this also puts us at a $200,000 market top.

III. Summation, Findings, and Caveats
Summation
Using just the data that the market provides us, we aimed at creating a frame-work based on Halvings. These findings are just one data set that we will cross reference in future articles following other methods in order to make mathematically significant discoveries. We identified the following ranges. For all the data see Section II above, but we took the liberty of rounding numbers and limiting to the ranges where findings overlapped:
Market Bottom: December 15th 2018 at 3207.53
Halving: May 17th 2020 at $7,800 - $15,500
Market Top: December 30th 2021 at $150,000 - $500,000
Market Bottom: December 2022 at around $25,000 - $100,000
Findings
Using the above ranges we find the following estimations both reasonable and fitting within the Halving framework. We will use these figures in the future to cross-reference with other analysis methods to determine correlation or contradiction.

Caveats
Lack of Sufficient Data
It has to be stated repeatedly that we are not prone to making decisions based on limited data sets. The reality is that the crypto asset markets are still nascent and provide us with just under a decade’s worth of price data. While these data sets are statistically insignificant compared to equity markets with around a century of data, the findings do gain relevance when looked at from a perspective of % of accuracy historically. For example it appears too coincidental that the three major market bottoms all happened around 500 days prior to Halving. It also appears too coincidental that the price at time of Halving is around 50% down from all time high. We also notice a lot of ‘Halving’ in growth. For example, the growth from the first peak to the second peak was roughly 40x, the growth from the second to the third peak was roughly half of that, at 20x. We don’t find it outlandish to project our next target at roughly 10x the prior top, placing us once again at $200k/Bitcoin in 2021-22.
The Future of Halvings
It remains to be said that the impact of Halvings will likely be tapering off over the coming years. The Halving of 2020 and 2024 may be the last making the impact Halvings have made in the past. The reason for this is it’s inflation.
As highlighted in the Data Chart, miner rewards have historically provided significant supply side to bitcoin’s economy. For the first time in bitcoin’s history, its inflation will fall below that of the US dollar in 2020, and by 2024 bitcoin’s inflation will be lower than the US dollar’s inflation for all but 3 years since 1956. At that point it will also become more scarce than gold based on stock-to-flow economics. More on stock to flow in the next article. However this grand scarcity effect caused by Halvings is greatly diminished after 2024. Whether Bitcoin has an annual .2% or .1% inflation rate, won’t have a significant effect on supply side economics. At that time there will be other supply side sources to keep an eye on, such as bitcoin being locked-up and/or re-leased from DeFi platforms.
Inflation is also tied to the economic power of miners. With an ever growing supply, and an ever shrinking flow, miners will hold a smaller and smaller portion of total supply, reducing the effects of their daily liquidations to run their operations as well as the effects of miner capitulations which historically mark price bottoms (more on miner capitulations in another article).
Disclaimers
The information contained or attached herein is not intended to provide, and should not be relied upon for, accounting, legal or tax advice or investment recommendations. This presentation may contain forward-looking statements that are within the meaning of Section 27A of the Securities Act of 1933 and Section 21E of the Securities Exchange Act of 1934. These forward-looking statements are based on management’s beliefs, as well as assumptions made by, and information currently available to, management. Although management believes that the expectations reflected in these forward-looking statements are reasonable, it can give no assurance that these expectations will prove to be correct. This email is for informational purposes only and does not constitute an offer to sell, or the solicitation of an offer to buy, any security, product, service of Hartmann Capital as well as any Hartmann Capital fund, whether an existing or contemplated fund, for which an offer can be made only by such fund’s Confidential Private Placement Memorandum and in compliance with applicable law. Past performance is not indicative nor a guarantee of future returns. Please consult your own independent advisors. All information is intended only for the named recipient(s) above and is covered by the Electronic Communications Privacy Act 18 U.S.C. Section 2510-2521. This email is confidential and may contain information that is privileged or exempt from disclosure under applicable law. If you have received this message in error please immediately notify the sender by return email and delete this email message from your computer. Copyright 2019 Hartmann Capital, LLC. All Rights Reserved.
NOT INVESTMENT ADVICE; FOR INFORMATION ONLY
PAST PERFORMANCE IS NOT A GUARANTEE OF FUTURE RESULTS